A Python microservice stack
First of all, let me say the word “microservice” is incredibly inflated these days, but some of the original reasons to use them still hold true. Part of its definition comes from SOA, with some added considerations:
- Services roughly map to business functions
- Services are autonomous (shared nothing architecture)
- Boundaries are explicit
- Services declare schemas and interfaces
- Company policy defines version compatibility
- Services are deployed separately
- Services are manageable by different teams
- Service unavailability is handled gracefully
- Service call stack is broad rather than deep
Recently I worked with a company that needed to scale product/engineering to 50+ people, which makes the investment towards this methodology justifiable. There is a cost in managing all this, but people’s autonomy pays this off quickly. In the future this cost might change, but I doubt it is going to be zero. Consider that it is much harder to change a microservice ecosystem than to change the layers of a monolithic software, because of its distributed nature.
Regarding the tools for this, I put together a proof of concept of a microservice stack. It is focused on Python to start with, but I picked tools that can be used from any language. In these environments you also do not need a generic framework like Django anymore, you can pick something more lightweight if the current service allows it.
- GRPC
- Consul
- StatsD
- Kafka
- SQLAlchemy/Alembic (Python specific)
All these tools together allowed me to put together a simplified version of a service they had in production already.
GRPC is a modern RPC library based on HTTP/2 and Protocol Buffers. The reason why I picked this instead of REST or a messaging queue is that it makes schemas and interfaces explicit. One could argue that Swagger (or similar) can be used for the same purpose, but in reality I have seen these files get out of date quickly because people forget.
GPRC forces you to generate client/server code out of “documentation” files, which makes them always be up to date. It is also an RPC protocol, which is inherently more flexible than a REST system. In addition to this, HTTP/2 is a multiplexed protocol, which finally means we are not forced to fit everything in one response, just because the frontend team wants performance.
Consul allows you to do mainly 2 things, service discovery and configuration storage. Service discovery is useful in case you want to stop thinking about servers as reference point for your architecture: your service should not rely on always be on the same server(s). Location may change in case servers get rebuilt and IPs change. This tool gives you a lot more flexibility in modifying your server infrastructure. Consul has also integrated healthcheck, which works with GRPC, so in case servers go down, you are redirected to a working copy on a different server.
Consul configuration storage is something that you may not decide to use it if you already have a highly available database, but what makes Consul stand out is the ability to watch for changes to selected keys, and trigger microservice restarts. There is a nice utility built by Hashicorp called envconsul, which copies values from Consul to environment variables, and restarts services, which is for instance the behaviour of Heroku.
Logging and monitoring are critical in distributed environments. StatsD and Kafka are both suitable for high-traffic environments, due to being battle-tested tech, and having asynchronous client libraries helps with this. Even though in theory you could base your monitoring on your logging system, I found that when you have high-throughput logging, the system tends to drop logging packets, and you do not get the full numbers. That is why I like separation between logging and monitoring.
Kafka seems to be all the craze these days. It is a messaging queue system unlike any other. It is not based on ack-ing messages (queues) or simple pub-sub (topics) but on a form of pub-sub with the ability to go back in time by specifying different starting offsets. It is an ideal setting for many applications, such as logging data processing. That is because it saves complexity server-side (explicit message marking) and client bandwidth (ack transmission), with the cost of mantaining more state on the client (offsets) and potentially a big storage buffer on the server.
Kafka allows you to process all messages, have at-least-once or at-most-once delivery, and a performant system, given that you are able to recover from client crash pretty quickly. If the time to recover is within the retention period of your Kafka queues, you will not have lost any message.
The code
Here is a very simple client/server implementation of a search service by geometry and/or name.
Proto file
syntax = "proto3";

import "google/protobuf/empty.proto";

message SearchRequest {
  string query = 1;
  float lat = 4;
  float lng = 5;
  int32 page_number = 2;
  int32 result_per_page = 3;
}

message SearchResponses {
    repeated SearchResponse responses = 1;
}

message SearchResponse {
    string response = 1;
}

message MonitorResponse {
    int32 n_things = 1;
}

service Search {
    rpc monitor(google.protobuf.Empty) returns (MonitorResponse) {}
    rpc search(SearchRequest) returns (SearchResponses) {}
}
You can then generate the server code and stub client code with this command:
python -m grpc.tools.protoc -I. --python_out=. --grpc_python_out=. search.proto
At this point you should get a file you can import in both client and server code. The client code is almost ready to use, while the server code gives you an abstract server class with empty methods that you would need to implement. In my version of GRPC, the file is called search_pb2.py.
Server
import time
import sys
import consul
import logging
import statsd
import random
import os

import search_pb2
from models import session, Thing, func

log = logging.getLogger()
log.setLevel(logging.DEBUG)

ch = logging.StreamHandler(sys.stdout)
ch.setLevel(logging.DEBUG)
formatter = logging.Formatter('%(asctime)s - %(name)s - %(levelname)s - %(message)s')
ch.setFormatter(formatter)
log.addHandler(ch)


_ONE_DAY_IN_SECONDS = 60 * 60 * 24

port = random.randint(50000, 59000)
stat = statsd.StatsClient('localhost', 8125)

class SearchServicer(search_pb2.SearchServicer):
    @stat.timer("search")
    def search(self, request, context):
        stat.incr("search_count")
        log.info("search request: " + str(request))
        query = session.query(Thing).filter(
                func.ST_Contains(Thing.geom, 'POINT({} {})'.format(request.lat, request.lng)))
        responses = [search_pb2.SearchResponse(response=rec.name) for rec in query]
        log.info("search responses: " + str(responses))
        return search_pb2.SearchResponses(responses=responses)

    @stat.timer("monitor")
    def monitor(self, request, context):
        stat.incr("monitor_count")
        n_things = session.query(Thing).count()
        return search_pb2.MonitorResponse(n_things=n_things)

def register():
    log.info("register started")
    c = consul.Consul()
    check = consul.Check.tcp("127.0.0.1", port, "30s")
    c.agent.service.register("search-service", "search-service-%d" % port, address="127.0.0.1", port=port, check=check)
    log.info("services: " + str(c.agent.services()))

def unregister():
    log.info("unregister started")
    c = consul.Consul()
    c.agent.service.deregister("search-service-%d" % port)
    log.info("services: " + str(c.agent.services()))

def serve():
  server = search_pb2.beta_create_Search_server(SearchServicer())
  server.add_insecure_port('[::]:' + str(port))
  server.start()
  log.info("server started")
  try:
    while True:
      time.sleep(_ONE_DAY_IN_SECONDS)
  except KeyboardInterrupt:
    server.stop(0)


if __name__ == '__main__':
    register()
    serve()
    unregister()
Along with the required models:
from sqlalchemy import create_engine, func
from sqlalchemy.ext.declarative import declarative_base
from sqlalchemy import Column, Integer, String
from geoalchemy2 import Geometry
from sqlalchemy.orm import sessionmaker


engine = create_engine("postgresql://user:password@localhost:5434/test")
Base = declarative_base()

class Thing(Base):
    __tablename__ = "thing"
    id = Column(Integer, primary_key=True)
    name = Column(String)
    geom = Column(Geometry('POLYGON'))

Session = sessionmaker(bind=engine)
session = Session()
In this very simple API server, you can see GRPC, Consul, statsD and SqlAlchemy all blended together, as a proof of concept. The server responds to 2 functions, one is the search function and another called monitor that returns some internal stats around the service.
Once you populated Postgresql with some data, you should be able to query the service with the client.
Client
import grpc
import sys
import logging
from dns import resolver

import search_pb2

log = logging.getLogger()
log.setLevel(logging.DEBUG)

ch = logging.StreamHandler(sys.stdout)
ch.setLevel(logging.DEBUG)
formatter = logging.Formatter('%(asctime)s - %(name)s - %(levelname)s - %(message)s')
ch.setFormatter(formatter)
log.addHandler(ch)

consul_resolver = resolver.Resolver()
consul_resolver.port = 8600
consul_resolver.nameservers = ["127.0.0.1"]

dnsanswer = consul_resolver.query("search-service.service.consul", 'A')
ip = str(dnsanswer[0])
dnsanswer_srv = consul_resolver.query("search-service.service.consul", 'SRV')
port = int(str(dnsanswer_srv[0]).split()[2])

log.info("creating grpc client based on consul data: ip=%s port=%d" % (ip, port))
channel = grpc.insecure_channel('%s:%d' % (ip, port))
stub = search_pb2.SearchStub(channel)

if len(sys.argv) == 1 and sys.argv[1] == "--monitor":
    monitresp = stub.monitor(search_pb2.google_dot_protobuf_dot_empty__pb2.Empty())
    log.debug("monitor response: {}".format(monitresp))
else:
    req = search_pb2.SearchRequest(
        query="queryabc",
        lat=float(sys.argv[1]),
        lng=float(sys.argv[2]),
        result_per_page=10)
    log.debug("sending request: {}".format(req))
    resp = stub.search(req)
    log.debug("received response: {}".format(resp))
The client is querying Consul DNS service to find the microservice, using the dnspython library.
Underlying services
Consul
As the code is written above, Consul is not optional. In order to quickly test the setup above, you can use Docker. Please consider that the following command does not start Consul with failover or any option that you would want to use in production.
docker run --net=host consul agent -server -ui -bootstrap -bind=127.0.0.1
With Consul, you are free to have multiple copies of the API server running on multiple nodes, and requests will be resolved with Round Robin. The healthcheck will take a copy of the service off the DNS list if it becomes unresponsive. You can also stop the service and before exiting, it will deregister itself.
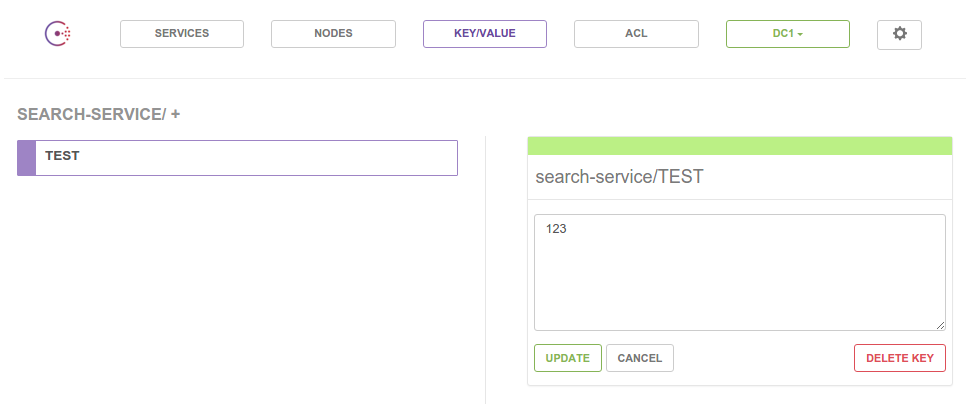
In order to get the benefits of centralized configuration management, you can start the service with envconsul:
./envconsul -consul localhost:8500 -prefix search-service python search_server.py
You can then add variables through the Consul UI and the service will be restarted automatically.
StatsD
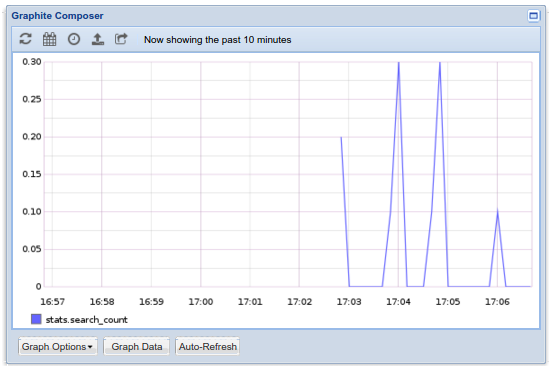
Again, you can use Docker to get running pretty quickly. Let’s start Graphite on port 8002 and StatsD on 8125.
docker run -p 8002:80 -p 8125:8125/udp -d samsaffron/graphite
The use we do here is quite basic, but it is enough to get an idea of the load on the service. With this data you can do estimates whether you have to run this on additional servers, or do some additional optimizations to the code.
Kafka
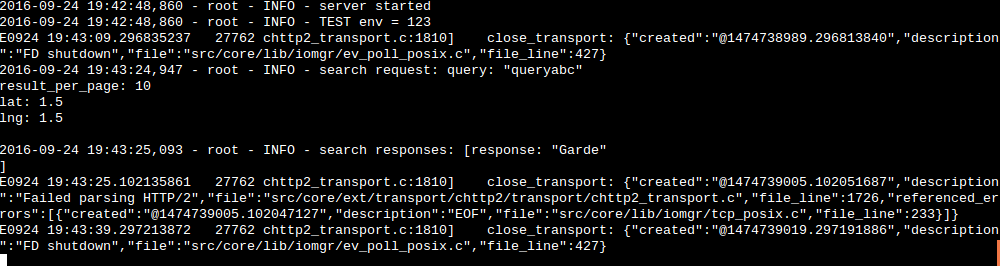
This component is optional in the above setup. If you run the code as it is, all logging goes to stdout. I find this very valuable when you are developing on your local machine. But on staging/production environments, you may want to stream the logs, and that is when you pick a tool like Kafka.
Let’s start a copy of Kafka by using the Docker image created by Spotify
docker run -p 2181:2181 -p 9092:9092 --env ADVERTISED_HOST=127.0.0.1 --env ADVERTISED_PORT=9092 spotify/kafka
After Kafka has succcessfully started, you can modify the envconsul command above to pipe all output to Kafka.
./envconsul -consul localhost:8500 -prefix search-service python search_server.py | kafkacat -P -b localhost -t search-service
And see all output back using kafkacat again:
kafkacat -b localhost -t search-service
This use of Kafka is quite basic, but it offers already enough to do a distributed “tail -f” of a service, regardless of its location. I will blog a bit more about a more advanced use of Kafka, for now that is all.