At work we run a lot of Nginx pods, which we use to serve static files to our web apps. We specify memory limits for all pods we run and, to get an estimate of what those numbers should be, I have been using Datadog.
It worked well so far, but with Nginx not so much. Nginx has a very low memory footprint, and relies a lot on the page cache when serving static files. The page cache (a.k.a. disk cache) is how the operating system speeds up frequent access to the same files.
Datadog reports memory usage for pods, but only for the RSS memory: it is not accounting for the disk cache. Kubernetes however is including disk cache usage when enforcing the memory limits (source here).
Increasing our memory limits from 20Mi to 500Mi made a huge difference, though Datadog keeps reporting the same RSS memory usage.
From:
> k describe deployment deployment-name
...
  Containers:
...
   nginx:
    Limits:
      cpu:     10m
      memory:  20Mi
    Requests:
      cpu:      1m
      memory:   5Mi
...
To:
> k describe deployment deployment-name
...
  Containers:
...
   nginx:
    Limits:
      cpu:     100m
      memory:  500Mi
    Requests:
      cpu:      20m
      memory:   50Mi
...
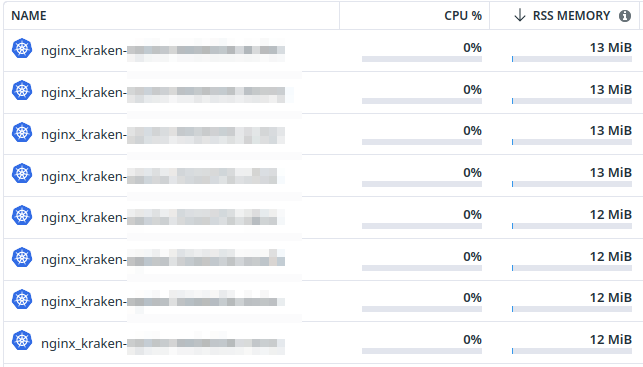
What DD keeps reporting:
What actually happens:
> curl -o /dev/null -s -w 'Total: %{time_total}s\n' https://support.oeg-kraken.energy/static/support/js/vendor/fontawesome-all.min.2ae534bdf847.js
Total: 5.764943s
That’s down from 25 seconds.
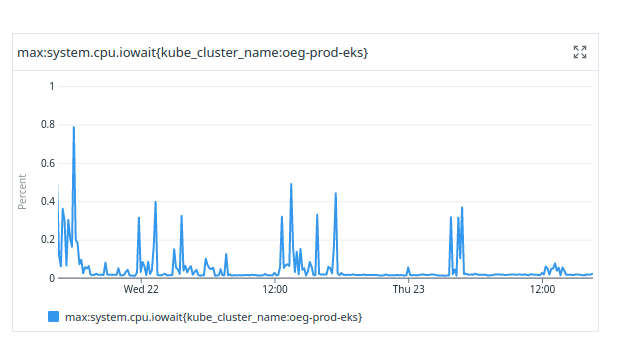
I am struggling to find a good metric on DD, but the one below look like a good one to use as reference. All the values for last day look lower, which is a good sign.